As a part of our ongoing Sas Curriculum, we are currently going through the book “Learning SAS® by Example “A Programmer’s Guide”” by Ron Cody.
Below are the codes and explanations to practice problems from chapter 7 – 15, that we were given as a learning assignment , For each practice problem the codes and explanations are summarized as under–
The permanent library used for creating the data set and proc reports is A15007.
------libname a15007 'C:\Users\user\Desktop\sasbook';
Code:
Code:
creating data set - sales
Data set SALES;
data sales;
infile datalines truncover;
input EmpID : $4.
Name & $20.
Region : $5.
Customer & $18.
Date : ddmmyy10.
Item : $8.
Quantity : 5.
UnitCost : 9.;
TotalSales = Quantity * UnitCost;
* format date ddmmyy10. UnitCost TotalSales comma9.;
* drop Date;
datalines;
1843 Sumit Mukhopadhya North Hero Pvt. Limited 10/10/2014 144L 50 800.99
1843 Sumit Mukhopadhya South Sobisco Delivery 11/10/2014 122 100 519.99
1843 Sumit Mukhopadhya North Arambaugh Utility 15/10/2014 188S 3 5199
1843 Sumit Mukhopadhya North Hero Pvt. Limited 15/10/2014 908X 1 5129
1843 Sumit Mukhopadhya South Nice & Fresh 15/10/2014 122L 10 290.95
0177 Dipti Chatterjee East Food Unlimited 1/9/2014 188X 100 667.99
0177 Dipti Chatterjee East Shop and Drop 2/9/2014 144L 100 856.99
1843 Sumit Mukhopadhya South Sobisco Delivery 18/10/2014 855W 1 9109
9888 Raju Singh West Sobisco Delivery 14/11/2014 122 50 589.99
9888 Raju Singh West Pet's are Our's 15/11/2014 100W 1000 178.99
0017 Pratap Kumar East Lalit's Spirits 15/11/2014 122L 500 396.99
0017 Pratap Kumar South Spirited Spirits 22/12/2014 407XX 100 199.95
0177 Dipti Chatterjee North Arambaugh Utility 21/12/2014 777 5 108.500
0177 Dipti Chatterjee East Hero Pvt. Limited 20/12/2014 733 2 10000
1843 Sumit Mukhopadhya North Arambaugh Utility 19/11/2014 188S 3 5199
;
Chapter 7
Problem 2
/* 2. Using the SAS data set Hosp, use PROC PRINT to list observations for Subject
values of 5, 100, 150, and 200. Do this twice, once using OR operators and once
using the IN operator.
Note: Subject is a numeric variable */
Code:
Code:
data a15007.hospques2;
set a15007.hosp;
where Subject = 5 or Subject = 100 or Subject = 150 or Subject = 200;
run;
/* OR */
data a15007.hospques22;
set a15007.hosp;
where Subject in(5,100,150,200);
run;
proc print data=a15007.hospques22;
run;
Output :


Problem 4
/*4. Using the Sales data set, create a new, temporary SAS data set containing Region
and TotalSales plus a new variable called Weight with values of 1.5 for the North
Region, 1.7 for the South Region, and 2.0 for the West and East Regions. Use a
SELECT statement to do this */
Code:
Code:
data a15007.salesques4;
set a15007.sales (keep = TotalSales Region);
select;
when (Region = 'North') Weight = 1.5;
when (Region = 'South') Weight = 1.7;
when (Region = 'East') Weight = 2.0;
when (Region = 'West') Weight = 2.0;
otherwise;
end;
run;
proc print data=a15007.Salesques4;
run;
Output :


Chapter 8
Problem 4
/*4. Count the number of missing values for the variables A, B, and C in the Missing data
set. Add the cumulative number of missing values to each observation (use variable
names MissA, MissB, and MissC). Use the MISSING function to test for the missing
values */
Code:
data a15007.missingdata;
input X $ Y Z A;
if missing(X) then misscounterX+1;
if missing(Y) then misscounterY+1;
if missing(Z) then misscounterZ+1;
if missing(A) then misscounterA+1;
datalines;
M 56 68 89
F 33 60 71
M 45 91 .
F 35 35 68
M . 71 81
M 50 68 71
. 23 60 46
M 65 72 103
. 35 65 67
M 15 71 75
;
proc print data=a15007.missingdata;run;
Output :


Problem 10
/*10. You are testing three speed-reading methods (A, B, and C) by randomly assigning
10 subjects to each of the three methods. You are given the results as three lines of
reading speeds, each line representing the results from each of the three methods,
respectively. Here are the results:
250 255 256 300 244 268 301 322 256 333
267 275 256 320 250 340 345 290 280 300
350 350 340 290 377 401 380 310 299 399
Create a temporary SAS data set from these three lines of data. Each observation
should contain Method (A, B, or C), and Score. There should be 30 observations in
this data set. Use a DO loop to create the Method variable and remember to use a
single trailing @ in your INPUT statement. Provide a listing of this data set using
PROC PRINT */
Code:
Code:
data a15007.reading;
do Method = 'MethodA','MethodB','MethodC';
do SNo=1 to 10;
input score @;
output;end;end;
datalines;
250 255 256 300 244 268 301 322 256 333
267 275 256 320 250 340 345 290 280 300
350 350 340 290 377 401 380 310 299 399
;
proc print data=a15007.reading noobs;
var Method score;
run;
Output :

Problem 14
/*14. Generate a table of integers and squares starting at 1 and ending when the square
value is greater than 100. Use either a DO UNTIL or DO WHILE statement to
accomplish this*/
*using DO UNTIL;
Code:
Code:
data a15007.square;
do Integers = 1 to 100 until (squares ge 100);
*using do until taking values from 1 to 100 and
specifying the condition for squares variable to
stop the loop when it reaches 100;
Squares = Integers * integers;
output;end;run;
proc print data=a15007.square;run;
*using IF STMT;
data a15007.square;
do Integers = 1 to 100 by 1;
Squares = Integers * integers;
if Squares gt 100 then leave;
output;end;run;
proc print data=a15007.square;run;
Output :

Chapter 9
Problem 6
* 6. Using the Medical data set, compute frequencies for the days of the week for the date
of the visit (VisitDate). Supply a format for the days of the week and months of the
year */
Code:
Code:
*loading the medical dataset in the permanent library;
data a15007.medical;
input @1 VisitDate mmddyy10. @12 patno $3.;
datalines;
11/29/2003 879
11/30/2003 880
09/04/2003 883
08/28/2003 884
09/04/2003 885
08/26/2003 886
08/31/2003 887
08/25/2003 888
11/16/2003 913
11/15/2003 914
;
run;
data a15007.ch9ques6;
set a15007.medical(keep=VisitDate); *taking medical data using set function;
Days = weekday(VisitDate); *fetching weekday from visitdate variable;
run;
proc format library = a15007; *providing format for days variable;
value days 1='Sun' 2='Mon' 3='Tue'
4='Wed' 5='Thu' 6='Fri'
7='Sat';
run;
title "Frequencies for Visit Dates";
proc freq data=a15007.ch9ques6;
tables Days / nocum nopercent;
format Days days.;
run;
Output :


Problem 10
/* 10. Using the Hosp data set, compute the number of months from the admission date
(AdmitDate) and December 31, 2007 (call it MonthsDec). Also, compute the number
of months from the admission date to today's date (call it MonthsToday). Use a date
interval function to solve this problem. List the first 20 observations for your
solution */;
Code:
Code:
data a15007.sevenques10;
set a15007.hosp; *you can find hosp dataset in the blog folder uploaded in the dropbox;
MonthDec = intck('month',AdmitDate,'31Dec2007'd);
*using intck function to find month difference between admitdate and 31Dec2007;
MonthToday = intck('month',AdmitDate,today());
run;
proc print data=a15007.sevenques10;
run;
Output :

Chapter 10
Problem 2
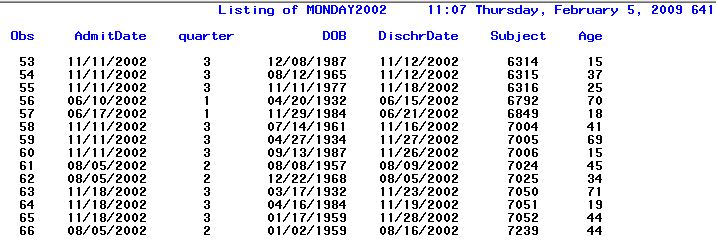
/* 2.Using the SAS data set Hosp, create a temporary SAS data set called Monday2002,
consisting of observations from Hosp where the admission date (AdmitDate) falls on
a Monday and the year is 2002. Include in this new data set a variable called Age,
computed as the person’s age as of the admission date, rounded to the nearest year */
Code:
Code:
data a15007.monday2002;
set a15007.hosp;
*you can take hosp dataset from blog folder uploaded in dropbox;
where year(AdmitDate) eq 2002 and
weekday(AdmitDate) eq 2;
*using where statement to specify the condition for AdmitDate
Weekday gives value of Monday as 2 as series starts from 1 for Sunday
Year(admitdate) gives year value of admitdate;
Age = round(yrdif(DOB,AdmitDate,'Actual'));
*using yrdif function to find difference between DOB and AdmitDate;
run;
title "Listing of MONDAY2002";
proc print data=a15007.monday2002;
run;
Output :
Problem 6
/*6. Repeat Problem 5, except this time sort Inventory and NewProducts first (create two
temporary SAS data sets for the sorted observations). Next, create a new, temporary
SAS data set (Updated) by interleaving the two temporary, sorted SAS data sets.
Print out the result.*/
Code:
Code:
/*Solution -5
title "Listing of INVENTORY";
proc print data=learn.inventory noobs;
run;
title "Listing of NEWPRODUCTS";
proc print data=learn.newproducts noobs;
run;
data updated;
set learn.inventory learn.newproducts;
run;
proc sort data=updated;
by Model;
run;
title "Listing of updated";
proc print data=updated;
run; */;
*Data set NEWPRODUCTS;
data a15007.newproducts;
input Model $ Price;
format Price dollar8.2;
datalines;
L939 10.99
M135 .75
;
*sorting inventory dataset by model variable;
proc sort data=a15007.inventory out=a15007.inventory;
by Model;
run;
*sorting newproducts dataset by model variable;
proc sort data=a15007.newproducts out=a15007.newproducts;
by Model;
run;
*merging all the rows of both the datasets into a single dataset updated;
data a15007.updated;
set a15007.inventory a15007.newproducts;
by Model;
run;
title "Listing of UPDATED";
proc print data=a15007.updated;
run;
Output :

Problem 10
/*10 Using the Purchase and Inventory data sets, provide a list of all Models (and
the Price) that were not purchased*/
Code:
Code:
*sorting the inventory dataset by Model Variable;
*Data set PURCHASE;
data a15007.purchase;
input CustNumber Model $ Quantity;
datalines;
101 L776 1
102 M123 10
103 X999 2
103 M567 1
;
proc sort data=a15007.inventory out=a15007.inventory;
by Model;
run;
*sorting the purchase dataset by Model Variable;
proc sort data=a15007.purchase out=a15007.purchase;
by Model;
run;
*merging two datasets by Model variable
using "IN=" to filter the datsets to find model that were not purchased along with the proce;
data a15007.notpurchased;
merge a15007.inventory(in=InInventory)a15007.purchase(in=InPurchase);
by Model;
if InInventory and not InPurchase;
keep Model Price;
run;
title "Listing of NOT PURCHASED";
proc print data=a15007.notpurchased noobs;
run;
Output :

Problem 14
/*14 Data set Inventory contains two variables: Model (an 8-byte character variable)
and Price (a numeric value). The price of Model M567 has changed to 25.95 and the
price of Model X999 has changed to 35.99. Create a temporary SAS data set (call it
NewPrices) by updating the prices in the Inventory data set*/
Code:
Code:
data a15007.modelnew;
input Model $ Price;
datalines;
M567 25.95
X999 35.99
;
*creating inventory data set* ;
data a15007.inventory;
input Model $ Price;
format Price dollar8.2;
datalines;
M567 23.50
S888 12.99
L776 159.98
X999 29.95
M123 4.59
S776 1.99
;
*sorting inventory data by model variable;
proc sort data=a15007.inventory out=a15007.inventory;
by Model;
run;
*updating inventory data with modelnew for price for the models;
data a15007.newprice;
update a15007.inventory a15007.modelnew;
by Model;
run;
proc print data=a15007.newprice ;
run;
Output :


Chapter 11
Problem 4
/* 4. The SAS data set Psych contains an ID variable, 10 question responses (Ques1–
Ques10), and 5 scores (Score1–Score5). You want to create a new, temporary SAS
data set (Evaluate) containing the following:
a. A variable called QuesAve computed as the mean of Ques1–Ques10. Perform
this computation only if there are seven or more non-missing question values.
b. If there are no missing Score values, compute the minimum score (MinScore),
the maximum score (MaxScore), and the second highest score (SecondHighest) */
Code:
*Data set PSYCH;
data a15007.psych;
input ID : $3. Ques1-Ques10 Score1-Score5;
datalines;
001 1 3 2 4 5 4 3 4 5 4 90 92 93 90 88
002 3 3 . . 3 4 5 5 1 . 95 . . 86 85
003 . . . . 5 5 4 4 3 3 88 87 86 85 84
004 5 3 4 5 . 5 4 3 3 . 78 78 82 84 .
005 5 4 3 2 1 1 2 3 4 5 92 93 94 95 99
;
data a15007.evaluate;
set a15007.psych;
*pysch dataset is present in the blog folder uploaded in dropbox folder;
if n(of Ques1-Ques10) ge 7 then QuesAve=mean(of Ques1-Ques10);
if n(of Score1-Score5) eq 5 then maxscore=max(of Score1-Score5);
if n(of Score1-Score5) eq 5 then Minscore=min(of Score1-Score5);
if n(of Score1-Score5) eq 5 then SecondHighest=largest(2,of Score1-Score5);
*using if then stmt to find max score min score secondhighest of the score variables;
run;
proc print data=a15007.evaluate;run;


Code:

/* 4. The SAS data set Psych contains an ID variable, 10 question responses (Ques1–
Ques10), and 5 scores (Score1–Score5). You want to create a new, temporary SAS
data set (Evaluate) containing the following:
a. A variable called QuesAve computed as the mean of Ques1–Ques10. Perform
this computation only if there are seven or more non-missing question values.
b. If there are no missing Score values, compute the minimum score (MinScore),
the maximum score (MaxScore), and the second highest score (SecondHighest) */
Code:
*Data set PSYCH;
data a15007.psych;
input ID : $3. Ques1-Ques10 Score1-Score5;
datalines;
001 1 3 2 4 5 4 3 4 5 4 90 92 93 90 88
002 3 3 . . 3 4 5 5 1 . 95 . . 86 85
003 . . . . 5 5 4 4 3 3 88 87 86 85 84
004 5 3 4 5 . 5 4 3 3 . 78 78 82 84 .
005 5 4 3 2 1 1 2 3 4 5 92 93 94 95 99
;
data a15007.evaluate;
set a15007.psych;
*pysch dataset is present in the blog folder uploaded in dropbox folder;
if n(of Ques1-Ques10) ge 7 then QuesAve=mean(of Ques1-Ques10);
if n(of Score1-Score5) eq 5 then maxscore=max(of Score1-Score5);
if n(of Score1-Score5) eq 5 then Minscore=min(of Score1-Score5);
if n(of Score1-Score5) eq 5 then SecondHighest=largest(2,of Score1-Score5);
*using if then stmt to find max score min score secondhighest of the score variables;
run;
proc print data=a15007.evaluate;run;
Output :

Problem 8
/* 8. Create a temporary SAS data set (Random) consisting of 1,000 observations, each
with a random integer from 1 to 5. Make sure that all integers in the range are
equally likely. Run PROC FREQ to test this assumption */
Code:
Code:
data a15007.random;
do i=1 to 1000;
x=int(rand('uniform')*5)+1;output ;end;
*here am using rand function to get random value between 1 and 5;
run;
proc freq data=a15007.random;
tables x/missing;run;
Output :

Problem 10
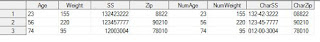
/* 10. Data set Char_Num contains character variables Age and Weight and numeric
variables SS and Zip. Create a new, temporary SAS data set called Convert with
new variables NumAge and NumWeight that are numeric values of Age and
Weight, respectively, and CharSS and CharZip that are character variables created
from SS and Zip. CharSS should contain leading 0s and dashes in the appropriate
places for Social Security numbers and CharZip should contain leading 0s
Hint: The Z5. format includes leading 0s for the ZIP code */
Code:
Code:
*Data set CHAR_NUM;
data a15007.char_num;
input Age $ Weight $ SS Zip;
datalines;
23 155 132423222 08822
56 220 123457777 90210
74 95 012003004 78010
;
data a15007.convert;
set a15007.char_num;
*char_num dataset is present in the blog folder uploaded in dropbox folder;
NumAge = input(Age,8.);
NumWeight = input(weight,8.);
*converting character variables weight and age into numeric variables;
CharSS = put(SS,ssn11.);
CharZip = put(Zip,z5.);
*converting numeric variables SS and Zip into character variables;
run;
proc print data=a15007.convert;
run;
Output :

Problem 12
/* 12. Using the Stocks data set (containing variables Date and Price), compute daily
changes in the prices. Use the statements here to create the plot.
Note: If you do not have SAS/GRAPH installed, use PROC PLOT and omit the
GOPTIONS and SYMBOL statements.
goptions reset=all colors=(black) ftext=swiss htitle=1.5;
symbol1 v=dot i=smooth;
title "Plot of Daily Price Differences";
proc gplot data=difference;
plot Diff*Date;
run;
quit; */
Code:
Code:
*Data set STOCKS;
data a15007.stocks;
Do date = '01Jan2006'd to '31Jan2006'd;
input Price @@;
output;
end;
format Date mmddyy10. Price dollar8.;
datalines;
34 35 39 30 35 35 37 38 39 45 47 52
39 40 51 52 45 47 48 50 50 51 52 53
55 42 41 40 46 55 52
;
data a15007.difference;
set a15007.stocks;
Diff = Dif(Price);
*using dif function to calculate the difference in thr price compared to the previous value;
run;
goptions reset=all colors=(black) ftext=swiss htitle=1.5;
symbol1 v=dot i=smooth;
title "Plot of Daily Price Differences";
proc gplot data=a15007.difference;
plot Diff * Date;
run;quit;
Output :

Chapter 12
Problem 2
/*2 Using the data set Mixed, create a temporary SAS data set (also called Mixed) with
the following new variables:
a. NameLow – Name in lowercase
b. NameProp – Name in proper case
c. (Bonus – difficult) NameHard – Name in proper case without using the
PROPCASE function*/
Code:
Code:
*Data set MIXED;
data a15007.mixed;
input Name & $20. ID;
datalines;
Daniel Fields 123
Patrice Helms 233
Thomas chien 998
;
data a15007.mixed;
set a15007.mixed;
*you can find mixed dataset in the blog folder uploaded in dropbox;
length First Last $ 15 NameHard $ 20;
NameLow = lowcase(Name);
*converting entire word into lower case;
NameProp = propcase(Name);
*making first letter of each work into uppercase;
First = lowcase(scan(Name,1,' '));
*converting entire word into lower case;
Last = lowcase(scan(Name,2,' '));
*converting entire word into lower case;
substr(First,1,1) = upcase(substr(First,1,1));
*converting entire word into upper case;
substr(Last,1,1) = upcase(substr(Last,1,1));
*converting entire word into upper case;
NameHard = catx(' ',First,Last);
*using catx making first letter of each work into uppercase,without using propcase;
drop First Last;
run;
proc print data=a15007.mixed;
run;
Output :
Problem 4
/*4 Data set Names_And_More contains a character variable called Height. As you can
see in the listing in Problem 3, the heights are in feet and inches. Assume that these
units can be in upper- or lowercase and there may or may not be a period following
the units. Create a temporary SAS data set (Height) that contains a numeric variable
(HtInches) that is the height in inches.*/
Code:
Code:
*Data set NAMES_AND_MORE;
data a15007.names_and_more;
input Name $20.
Phone & $14.
Height & $10.
Mixed & $8.;
datalines;
Roger Cody (908)782-1234 5ft. 10in. 50 1/8
Thomas Jefferson (315) 848-8484 6ft. 1in. 23 1/2
Marco Polo (800)123-4567 5Ft. 6in. 40
Brian Watson (518)355-1766 5ft. 10in 89 3/4
Michael DeMarco (445)232-2233 6ft. 76 1/3
;
data a15007.height;
set a15007.names_and_more(keep = Height);
Height = compress(Height,'INFT.','i');
*using compress function with "i" argument to remove characters and to ignore cases;
/* Alternative
Height = compress(Height,' ','kd');
*keep digits and blanks;
*/
Feet = input(scan(Height,1,' '),8.);
Inches = input(scan(Height,2,' '),?? 8.);
*using scan function to extract values around the characters from the variable
1 value before space and 2 for value after two for ;
if missing(Inches) then HtInches = 12*Feet;
else HtInches = 12*Feet + Inches;
drop Feet Inches;
run;
title "chapter 12 - problem 4";
proc print data=a15007.height;
run;
Output :

Problem 6
/*6 Data set Study (shown here) contains the character variables Group and Dose. Create
a new, temporary SAS data set (Study) with a variable called GroupDose by putting
these two values together, separated by a dash. The length of the resulting variable
should be 6 (test this using PROC CONTENTS or the SAS Explorer). Make sure that
there are no blanks (except trailing blanks) in this value. Try this problem two ways:
first using one of the CAT functions, and second without using any CAT functions*/
Code:
Code:
*Using CAT functions;
*Data set STUDY;
data a15007.study;
input Subj : $3.
Group : $1.
Dose : $4.
Weight : $8.
Subgroup;
datalines;
001 A Low 220lbs. 2
002 A High 90Kg. 1
003 B Low 88kg 1
004 B High 165lbs. 2
005 A Low 88kG 1
;
data a15007.study;
set a15007.study;
length GroupDose $ 6;
GroupDose = catx('-',Group,Dose);
*here we are using catx to supply "-" as a separator between Group and Dose variables;
run;
title "chapter 12 - problem 6";
proc print data=a15007.study;
run;
*Without using CAT functions;
data a15007.study;
set a15007.study;
length GroupDose $ 6;
GroupDose = trim(Group) || '-' || Dose;
*using trim function to trim any space around thr values in Group and
Dose and join them and supply "-" in between the two values;
run;
proc print data=a15007.study;
run;
Output :

Problem 8
/*8 Notice in the listing of data set Study in Problem 6 that the variable called Weight
contains units (either lbs or kgs). These units are not always consistent in case and
may or may not contain a period. Assume an upper- or lowercase LB indicates
pounds and an upper- or lowercase KG indicates kilograms. Create a new, temporary SAS data set (Study) with a numeric variable also called Weight (careful here) that
represents weight in pounds, rounded to the nearest 10th of a pound.
Note: 1 kilogram = 2.2 pounds*/
Code:
Code:
data a15007.study;
set a15007.study(keep=Weight rename=(Weight = WeightUnits));
Weight = input(compress(WeightUnits,,'kd'),8.);
*using compress(kd)inside input function to keep numerical values alone from the string
and change if character variables present to numerical;
if find(WeightUnits,'KG','i') then Weight = round(2.2*Weight,.1);
*using find function with "i" argument to remove characters and to ignore cases;
else if find(WeightUnits,'LB','i') then Weight = round(Weight,.1);
run;
title "chapter 12 - problem 8";
proc print data=a15007.study;
run;
Output :

Chapter 13
Problem 4
/* 4.Data set Survey2 has five numeric variables (Q1–Q5), each with values of 1, 2, 3, 4,
or 5. You want to determine for each subject (observation) if they responded with a
5 on any of the five questions. This is easily done using the OR or the IN operators.
However, for this question, use an array to check each of the five questions. Set
variable (ANY5) equal to Yes if any of the five questions is a 5 and No otherwise.*/
Code:
Code:
*Data set SURVEY2;
data a15007.survey2;
input ID
(Q1-Q5)(1.);
datalines;
535 13542
012 55443
723 21211
007 35142
;
data a15007.any5;
set a15007.survey2;
array Ques{5} Q1-Q5;
Any5 = 'No ';
do i = 1 to 5;
if Ques{i} = 5 then do;
Any5 = 'Yes';
leave;
end;
end;
drop i;
run;
title "chapter 13 - problem 4";
proc print data=a15007.any5;
run;
Output :

Chapter 14
Problem 2
/*14.2 Using the data set Sales, create the report shown here:*/
Code:
Code:
proc sort data=a15007.sales out=a15007.sales;
by Region;
run;
title "Sales ";
proc print data=a15007.sales;
by Region;
id Region;
var Quantity TotalSales;
sumby Region;
run;
Output :

Chapter 15
Problem 2
/*2 Using the Blood data set, produce a summary report showing the average WBC and
RBC count for each value of Gender as well as an overall average. Your report should
look like this:*/
Code:
Code:
*Data set BLOOD;
data a15007.bloodnew;
infile 'C:\Users\user\Desktop\sasbook\60864_example\blood.txt' truncover;
length Gender $ 6 BloodType $ 2 AgeGroup $ 5;
input Subject
Gender
BloodType
AgeGroup
WBC
RBC
Chol;
label Gender = "Gender"
BloodType = "Blood Type"
AgeGroup = "Age Group"
Chol = "Cholesterol";
run;
title "ch15-problem2";
proc report data=a15007.bloodnew nowd headline;
column Gender WBC RBC;
define Gender / group width=6;
define WBC / analysis mean "Average WBC"
width=7 format=comma6.0;
define RBC / analysis mean "Average RBC"
width=7 format=5.2;
rbreak after / dol summarize;
run;
quit;
Output :

Problem 4
/*4 Using the SAS data set BloodPressure, compute a new variable in your report. This
variable (Hypertensive) is defined as Yes for females (Gender=F) if the SBP is
greater than 138 or the DBP is greater than 88 and No otherwise. For males
(Gender=M), Hypertensive is defined as Yes if the SBP is over 140 or the DBP is over
90 and No otherwise. Your report should look like this:*/
Code:
*Data set BLOODPRESSURE;
data a15007.bloodpressure;
input Gender : $1.
Age
SBP
DBP;
datalines;
M 23 144 90
F 68 110 62
M 55 130 80
F 28 120 70
M 35 142 82
M 45 150 96
F 48 138 88
F 78 132 76
;
title "ch15-problem4";
proc report data=a15007.bloodpressure nowd;
column Gender SBP DBP Hypertensive;
define Gender / Group width=6;
define SBP / display width=5;
define DBP / display width=5;
define Hypertensive / computed "Hypertensive?" width=13;
compute Hypertensive / character length=3;
if Gender = 'F' and (SBP gt 138 or DBP gt 88)
then Hypertensive = 'Yes';
else Hypertensive='No';
if Gender = 'M' and
(SBP gt 140 or DBP gt 90)
then Hypertensive = 'Yes';
else Hypertensive = 'No';
endcomp;
run;
quit;
Output :

Note : In order to work out the same problems in your own sas editor please find the attached URL where by you can have an access to the problems, the codes and even the data sets used to work upon !!
URL: https://www.dropbox.com/sh/glddfxpmr9ad9sj/AADuwUe4TDpG6CmvddS8p9uka?dl=0
Thanks !
URL: https://www.dropbox.com/sh/glddfxpmr9ad9sj/AADuwUe4TDpG6CmvddS8p9uka?dl=0
Thanks !
Your blog will look much better, if you:
ReplyDelete1. Make it more structured, like having separate page for each chapter and have an index page, linking the pages (for the chapters). You can also add links at each chapter to go back to index, previous (if any) and next (if any) pages.
2. Introduce the chapter (i.e. the page) in your own words.
3. For each problem, explain the problem you are attempting to solve. Your approach here is OK.
4. You can use screenshots for the programs as well. Make sure that the screenshots you are putting in your blog are all equally readable and they do not have unnecessary whitespace or other items in them. Crop the screenshots as necessary.
5. For each problem solved, write what you learned by solving the problem. Even one line is fine for this.
6. Write a conclusion or summary for each page.
Remember to :
1. Number the problems solved by giving Chapter # and Problem # (similar to what you did)
2. "Beautify" the programs before posting. There a menu item in SAS studio, which does the beautification for you. Also, you may like to post the programs, the way you have posted the result.
It would help, if you can think of this exercise as making your class notes and homework copy, combined.
I understand, it is lot of work now, given you are trying to do it at eleventh hour. For the next submission, if time permits, you can give it a try.
Cheers
It'sVery informative blog and useful article thank you for sharing with us , keep posting learn more
ReplyDeleteHadoop admin Online Course Hyderabad
This is when they look for Contract Law Assignment Help online. We are the most popular and affordable service provider in the USA, with a team of experts who make sure to curate the content within a short period of time by gathering relevant information from reliable sources.
ReplyDeleteNepal Tour Packages Wonderful post! I am getting the wonderful ideas to explore top popular tourist attractions of Nepal. Travelers can learn important tips to get the best deals for Nepal tourism packages. This blog is very interesting for me. I am very happy for this amazing blog.
ReplyDeleteNepal Tour Package
Nepal Tour
Nepal Tourist Packages
Assignment Help Perth
ReplyDeleteDo you want Assignment Help in Perth? Best Assignment Experts is the answer to all of your queries. We are a group of + a hundred and fifty PhD. professors, specialists, and pupils who offer amazing writing, authentic and tailored Assignment Help perth. Our carrier could be very low-priced and offers interesting offers.
kayseriescortu.com - alacam.org - xescortun.com
ReplyDeletetiously. We have referenced the gainful rules to clean the obstructed printer head. Accordingly, stay tuned till the end!hp printer support number
ReplyDeleteReaders are always admiring informational blogs, and this is truly one of them. You did a great job. If you want to enhance writing skills, Sourceessay.com based assignment writer is the best solution for you. Write that essay
ReplyDeleteRoku Error Code 009
ReplyDeleteThis comment has been removed by the author.
ReplyDeleteGreat work! I have also written the article based on Spacebar counter The spacebar speed test is a very beneficial and fun tool for beginners. Please comment your view after visiting it. Thank you.
ReplyDeletebengali traditional saree
ReplyDeletetraditional wedding sarees
smm panel
ReplyDeletesmm panel
İŞ İLANLARI
İNSTAGRAM TAKİPÇİ SATIN AL
hirdavatciburada.com
beyazesyateknikservisi.com.tr
Servis
tiktok jeton hilesi
Bien... Sigan con el fantástico trabajo; el artículo es realmente informativo. Aprecio tu compartir. Dado que está en este perfil contador de clicks, solo hay una forma de contar la cantidad de clics del mouse en cada período. Esta es una excelente manera de realizar un seguimiento de los clics.
ReplyDeleteEscape to a luxurious resort in jaipur, where royal elegance meets modern comfort. Enjoy world-class amenities, serene landscapes, and unforgettable experiences.
ReplyDeleteHL7 integration services employs message-based communication to convey healthcare data, specifying the structure and content of messages. This approach guarantees consistent data formatting, facilitating transmission across diverse system architectures. It supports the exchange of patient information, including demographics, laboratory results, and clinical orders.
ReplyDelete